Listed on 
Don't have an account?
Register via AppHave an account?
Login
Don't have an account?
Register via AppHave an account?
Login
Hi and welcome aboard! Today we’re going to discuss the momentum indicator – an important part of technical analysis. In previous articles, we’ve already talked about basic terms in technical analysis and gave you a taste of the RSI index, which is closely related to momentum. Now, it’s time for us to look deeper into momentum and figure out how some traders use it when making decisions.
Are you ready to get started? You better be, because here we go…
Let’s begin by explaining the concept of ‘momentum’. Momentum is the speed or force of movement. In trading, momentum is the rate of acceleration of an instrument's price or volume. Confused? In simpler words: How fast the price or the volume is increasing. In technical analysis, momentum is commonly used to identify trend lines. It’s viewed as an oscillator. What’s that? We’re just getting to it.


Good to know:
Historically, momentum is more useful when markets are rising than when markets are falling.
We promised you could find an automatic momentum indicator on the iFOREX platform and we’re going to deliver. If you are on the ‘charts’ section of the iFOREX trading platform, simply click on the ‘Indicator Wizard’, choose oscillators (because – as we said – momentum is an oscillator) and then add ‘Momentum’.
You can also add the indicator directly on the chart appearing on your deal slip.
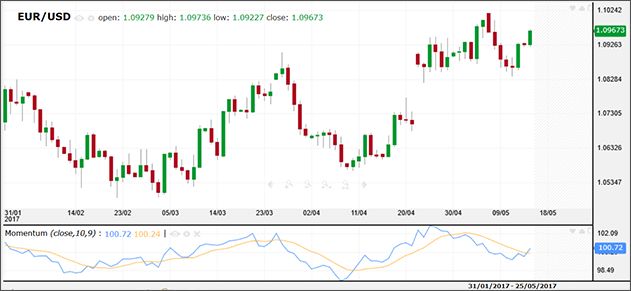
Here is what the momentum indicator looks like when overlaid on a standard chart:
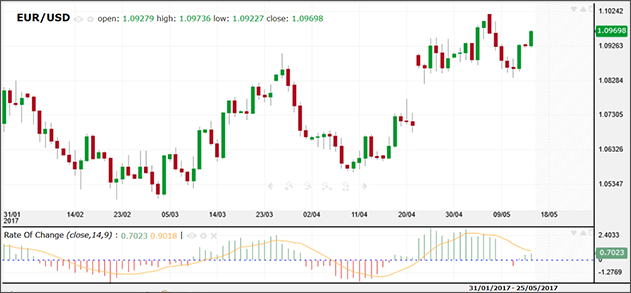
Rate of change (ROC) is a valuable technical indicator of momentum. Its aim is to measure the percent change in price from one period to another. As the ROC moves from positive to negative, it fluctuates above and below the zero line. When used as a momentum oscillator, ROC can be viewed as offering signals on divergence, centerline crossovers and – of course – when an instrument is overbought or oversold.
For example, if the price of an instrument closes higher today than it did 10 days ago, the ROC value point will be above the center line, indicating that prices are rising. If the price of the instrument closes lower today than it did 10 trading days ago, the value point will be below the centerline, indicating that prices are falling. A rising ROC could indicate a short term bullish signal, and a falling ROC could indicate a short term bearish signal.
Remember: Timeframe is crucial when dealing with ROC.

The RSI, AKA the Relative Strength Index, attempts to measure momentum by comparing higher closes and lower closes. Usually, the RSI is used on a 14-day timeframe. If a specific instrument has more – or stronger - positive changes, it will have a higher RSI than an instrument that had more - or stronger - negative changes.
RSI has a scale of 0 to 100. The 70 line is viewed as a high level and 30 as low. If the level is higher or lower – 80 and 90 or 20 and 10 – it could indicate a much stronger momentum.
Here’s an example of what the RSI looks on a standard chart…
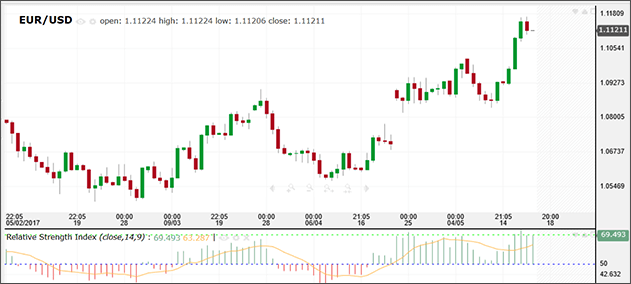
This is just the tip of the iceberg of course. If you want to know more about this fascinating indicator, check out our in-depth RSI page.
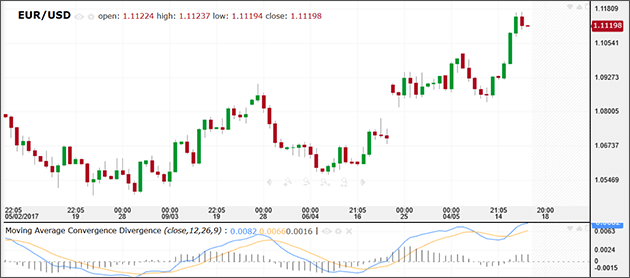
MACD (Moving Average Convergence/Divergence) is a technical indicator aimed at unveiling changes in a trend’s momentum – but not just momentum – also direction, duration and strength. MACD displays the relationship between two moving averages of instrument prices.
Here’s an example of what the MACD looks like on the iFOREX platform:
Do you now know enough to start using MACD? Far from it, but if you drop by our MACD page, you can learn more.
You probably heard about Bollinger Bands, but did you know that there is also a variation called Double Bollinger Bands? Essentially, these are two sets of regular Bollinger Bands.
Don’t know who Bollinger was and how his bands are used by traders? Our Bollinger Bands page covers this topic in depth. You already know your basics? Great, let’s move on.
There are several reasons for why some traders use double - rather than classic - Bollinger Bands. One is that ‘doubles’ can offer a lot more information regarding momentum.
How do you compose Double Bollinger Bands? Simply place a standard Bollinger Band with a setting at the 20-day moving average with a standard deviation of 1. Then add another Bollinger Band with a standard deviation of 2. Both are placed over the same time period, creating a spread between the bands. This - in theory - offers stop-losses and profit targets.

Now we know, using the term ‘simply’ was perhaps somewhat of an overreach, but in truth, once you get the hang of the Double Bollinger, you will see it’s not all that different than using standard Bollinger Bands – all it takes is some practice.
Now, let’s get back to our ‘Double’. The spread between the standard deviations offers indications of entry and exit points. For example, a cross above the first standard deviation is viewed as a buy signal (the profit target is at the second standard deviation and the stop-loss is the first standard deviation). What happens when you see a cross below the first standard deviation? This is viewed as a short signal (the profit target is located at the lower band of the standard deviation and a break back above the first standard deviation is seen as the stop-loss).
Note: Traders sometimes alter the number of standard deviations as well as the duration and type of the moving average.
If you are confused, we don’t blame you – this is a lot to take in. Even if you are a well-seasoned trader, there is really no way of covering the whole concept of Double Bollinger Bands in a couple of paragraphs. If you want to master this theory and get a better insight of how it works in practice, you will need to do some additional reading.
In theory, the momentum indicator can be used as indication of trade signals. Here are some examples:
These are just examples of course. As we’ve explained above, in many cases traders will not use momentum on its own, but alongside additional indicators and strategies.
Remember: While momentum is at the heart of many trades, it’s not without its shortcomings and just like any strategy, it will not always work effectively – or work at all.
Want to know what’s happening in the markets right now?
Check out our daily market analysis.
Join iFOREX to get an education package and start taking advantage of market opportunities.
 A beginner's e-book
 $5,000 practice demo account
 A 12-part video course
 Trusted partner
 Featured partner