Listed on 
Don't have an account?
Register via AppHave an account?
Login
Don't have an account?
Register via AppHave an account?
Login
Professional basketballers know to beware of the “pump fake” – when an attacking player positions himself to shoot, only to hold onto the ball while the defender flails helplessly in the air. Pump fakes can be difficult to recognize, especially when the attacker modifies his eye and body language to indicate he’s about to shoot.
For participants in the global forex market, there’s a very similar challenge to this one. Dropping chart prices may form a reversal pattern, prompting traders to open a long position on the pair, but then continue on their downward trajectory, leaving buyers in the lurch. Alternatively, there could be several reasons to expect prices to keep falling, but, nevertheless, we see they start a powerful push upwards, depriving traders of a valuable opportunity to jump on the bullish price train.
Basketball players and online traders alike need a way of distinguishing the telltale signals of real movements from their fake counterparts. In forex trading, one way is through looking at moving averages to determine the direction of the major trend. Another way is by consulting the RSI indicator, which suggests to us, through reviewing past market behaviour, whether conditions for the pair are overbought or oversold. A third way is by turning to trading volume.
Taking the case where the EUR/USD bounces off a strong support level, traders would feel a lot more confident in the bullish case for the pair when the movement occurs on elevated volume. That’s because high volume proves there is real demand in the market to drive prices even higher. Should the EUR/USD rebound off the same resistance on low volume, this could feasibly be a “pump fake” because buying interest appears weak. Thus, a quick glance at a volume indicator may save you heavy financial losses, or alternatively set you up for great gains.
But what does trading volume mean? And, how, practically, can you make use of it to enhance your online dealmaking?

For a forex pair like EUR/USD, trading volume refers to the sum total of these pairs traded within a given period. The issue of how to calculate volume in forex, then, comes down to counting the units that changed hands. There are, however, various tools that can be utilized to incorporate volume into your trading strategy.
For instance, on-balance volume (OBV) keeps a running tally of volume for a particular pair. When OBV is rising, it means that more and more trades are being executed with this pair. Falling OBV indicates that fewer and fewer people are trading it. Imagine the case where prices for the EUR/USD have been consistently surging for several sessions, but OBV records a decline. The likelihood is that a bearish reversal may be on its way.
Volume-weighted average price (VWAP) looks at the times in the trading day when volume was greatest and establishes the average price paid for the pair in those periods. Traders will use VWAP to assess the trajectory of price trends: When the current price exceeds VWAP, it could signify a bullish trend is building up, so traders may decide to go long on the pair; when prices are below VWAP, traders may go short.
Volume rate of change (VROC) measure the speed of change in trading volume over time. When VROC surges for your pair, it shows not just that more people are trading it, but also that the influx of new participants is accelerating. Thus, if the breakout on your chart is accompanied by high VROC, there is more reason to believe in it.
Volume indicators don’t open a clear, transparent window onto price trends. They are more like frosted glass partitions: Through them, we can recognize whether or not there is activity on the other side, but not the direction in which the activity is trending. The wise forex trader takes all available information into account, including chart patterns and technical indicators, before deciding how to interpret trading volume. It’s like a detective gathering evidence for a case. Here’s an example of how that might look in live trading action.
Take the case where you’re monitoring the GBP/USD currency pair on a four-hour chart and spy a Double Bottom formation. This pattern, which appears near the bottom of a downtrend, resembles a capital letter “W” and suggests prices have found solid support. In our case, prices fall to 1.2200 before rebounding to 1.3500, only to drop again to 1.2200. If it is a true Double Bottom, it will precede a bullish surge in prices in sessions to come, but this would only occur if selling pressure is exhausted on the second trough in the “W”, leaving the buyers free to push prices higher.
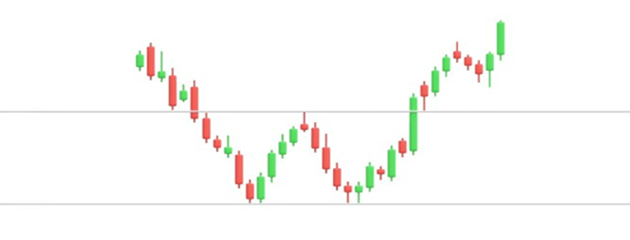
In our example, the candlestick at the base of the second trough is only a doji, rather than a strong bullish indicator, so we feel less confident in our Double Bottom. Additionally, a glance at the RSI (relative strength index) shows that its low points are not rising – which would suggest the GBP/USD is oversold and due to surge. With a dearth of proof for an upcoming rally, we abandon our Double Bottom and refrain from opening any deal.
However, we decide to check out volume on the formation before moving on. The volume on the first trough (at 1.2200) is normal for a downtrend like the one preceding the pattern. The volume on the second trough (at the same price level) is markedly higher. Why are there so many more traders involved this time around in lowering prices to precisely the same level? This could signify an accumulation of buying pressure behind the scenes.
Then, as prices rise towards the level of 1.3500, we see volume increases further, suggesting more traders are interested in that bullish move. Now, when prices break above 1.3500, with volume still rising, we do, in fact, have a strong basis to open a buy deal on the pair. Despite the weak doji signal on the second trough and the blank drawn by the RSI, we have solid evidence that buyers are queuing up to buy the GBP/USD. The increased volume on the second trough was the result of new buying pressure in the market – not old selling pressure, which has actually been exhausted.
Consulting volume indicators can save you from costly “pump fakes” – following phantom trends to your own detriment – and also from missing out on grand opportunities in the making. For the forex trading detective, they constitute a crucial tool in his investigation kit. While not necessarily sufficing on their own to predict future price action, when combined with other indicators they can often open up a “breakthrough” moment – suggesting to the trained eye what the dominant price trend is going to be down the line.
Join iFOREX to get an education package and start taking advantage of market opportunities.
 A beginner's e-book
 $5,000 practice demo account
 A 12-part video course
 Trusted partner
 Featured partner